When a dashboard is the right tool
| Situation | Best screen | Reason |
|---|---|---|
| You need to see several systems at a glance. | Dashboards | One screen can show KPIs, trends, warnings, and aggregate states. |
| You need to send a command to one device. | Control | Control keeps the device, channels, and commands in one exact context. |
| You need to change channels, addresses, or commands. | Setup | Dashboard displays and aggregates data. It is not the device editor. |
| You need to understand why a value is not updating. | Diagnostics / Logs | Diagnostics explains the cause, not only the final widget state. |
View mode
View is the normal operator mode. The dashboard opens as a dense information panel. Widgets update without rebuilding the whole page, so long screens should not jump back to the top on every refresh.
Overview panel
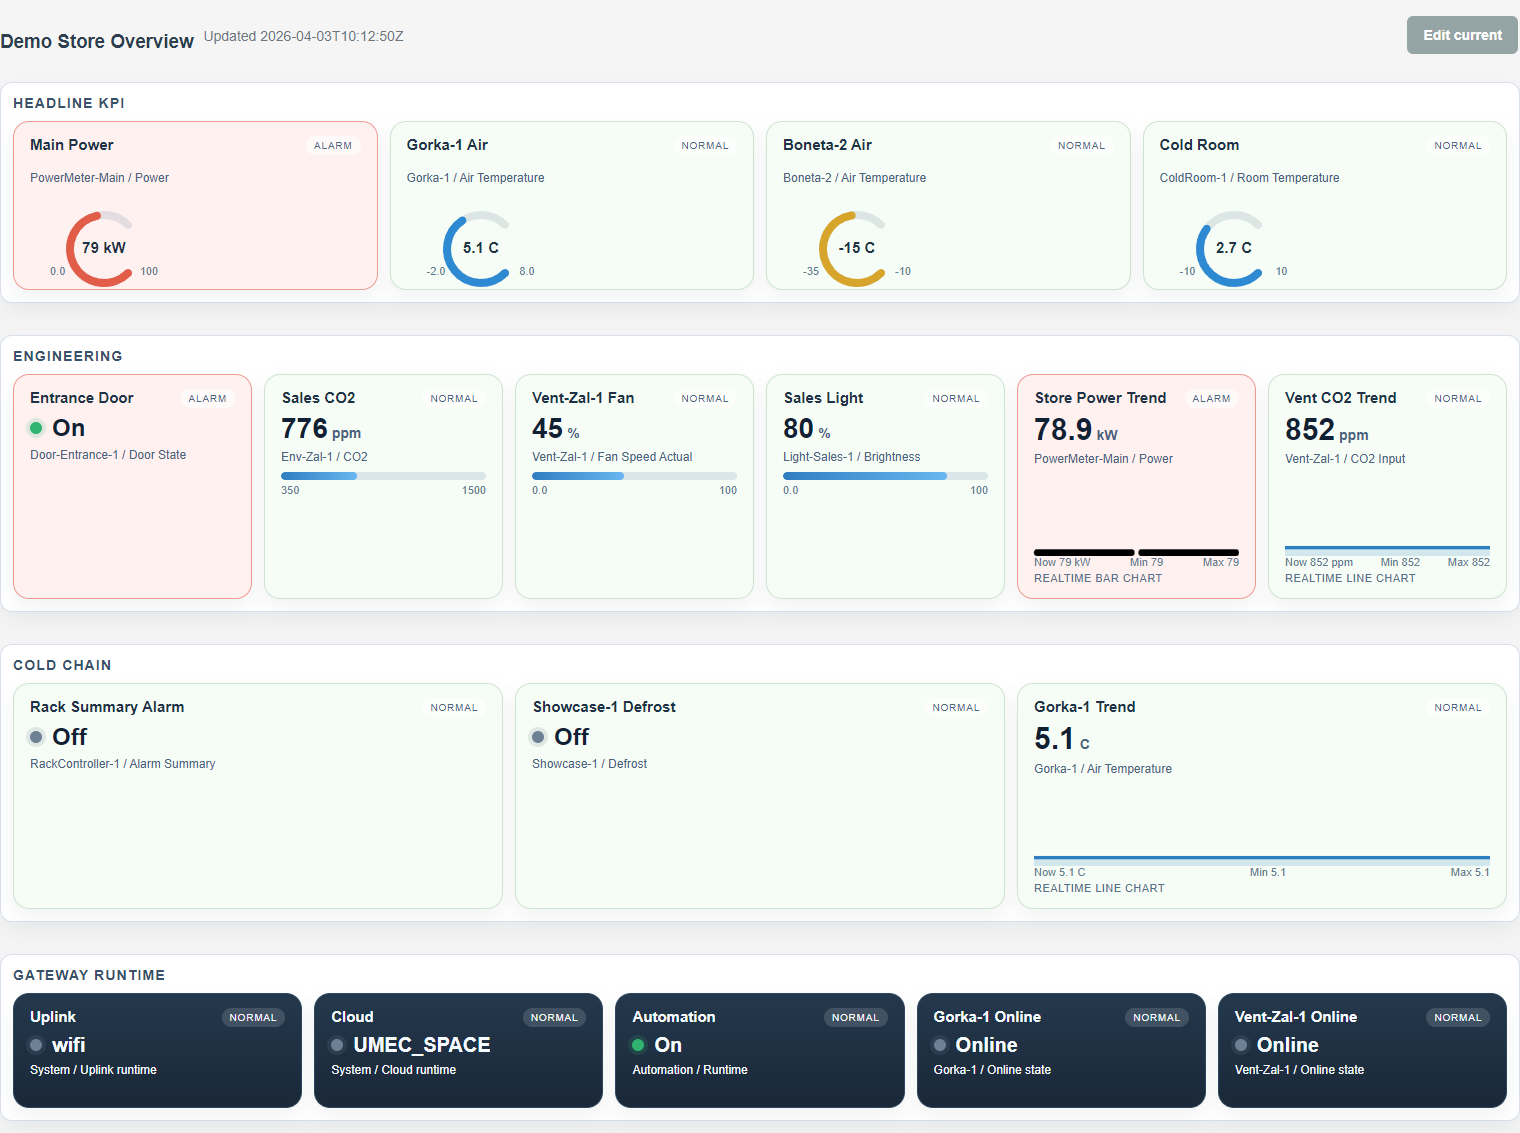
Warning state
Edit mode
Edit is used to prepare the panel: create a dashboard, set its title, add sections, choose sources, configure widgets, and save. Unsaved changes must be visible.
Widget types and interpretation
| Type | Use for | How to read it |
|---|---|---|
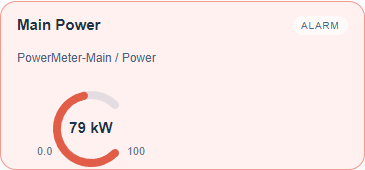
| Single value | Temperature, humidity, CO2, meter value, pressure. | Check the value, unit, and source freshness. |
| Gauge | KPIs with a known range: 0-100 %, ppm, load, level. | Read the position in the range and the color zone. |
| Trend | Values where movement matters more than one number. | Look for growth, drop, spikes, and range violations. |
| State panel | On/off, alarm/normal, available/unavailable. | No numeric scale is needed. The state itself is what matters. |
Default dashboard
One dashboard can be marked as default. It opens automatically when the page is loaded. Use this for the panel operators need most often. A good default panel answers one question: "is the site currently normal?"
Signs of a good dashboard
- The first screen shows the most important site states.
- Every widget has a clear source and unit.
- Warnings stand out without turning the panel into visual noise.
- The dashboard does not duplicate the entire Control page.
- If a source is missing, the widget shows degradation explicitly instead of hiding it behind an old value.