The main idea of daily operation
In everyday use the gateway serves three practical purposes: it shows current equipment state, helps the operator notice abnormal situations quickly, and allows commands to be sent when needed.
If a user opens the interface and still cannot understand what is happening on the site, then the documentation and interface are still not doing their job well enough.
Why the Control page exists
Control is the main working page for the selected device. It should help the operator answer simple questions quickly: which device is selected, what are its current values, is it currently reachable, and can it accept commands.
- If a device is shown but its values are not arriving, that is not "normal" and should trigger investigation.
- If a command is sent, the outcome should be clear: either it succeeded or it did not.
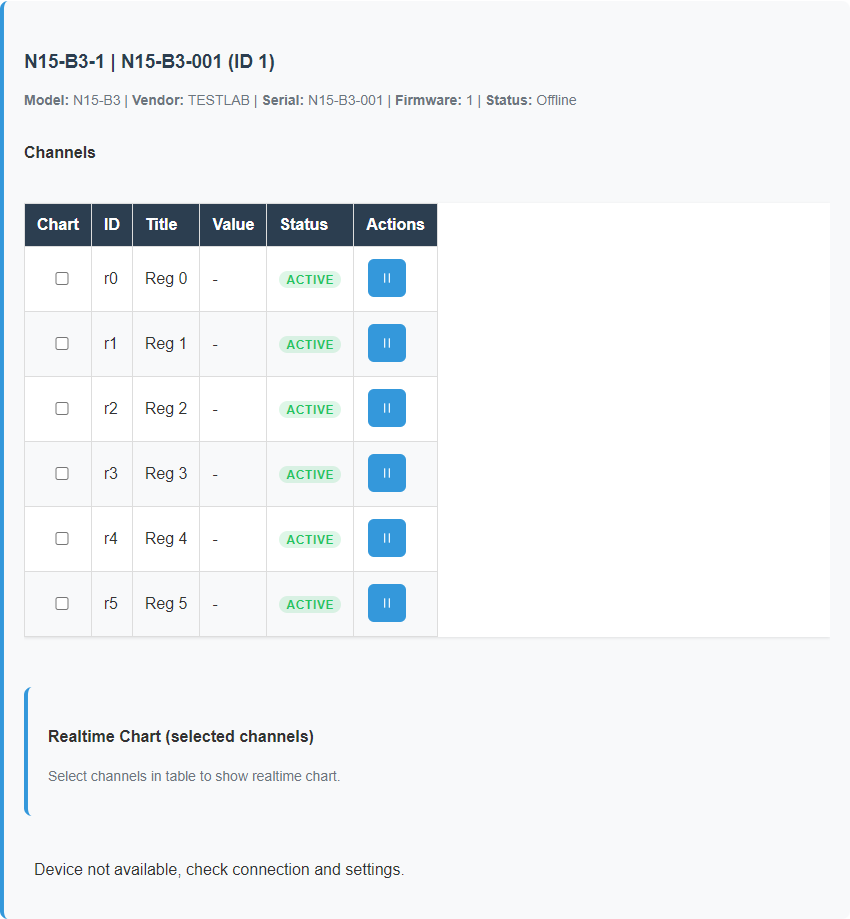
- If a device is unavailable, the interface should help the operator notice that instead of hiding the problem.
How to read device state correctly
It is important to distinguish between three different things: a device exists in configuration, a device is currently reachable, and the values are fresh. These are not the same thing.
flowchart TD
    A[The device exists
in configuration] --> B[The gateway polls it]
    B --> C{Do responses arrive?}
    C -- Yes --> D[Values are fresh
and usable]
    C -- No --> E[Communication is lost
or unstable]
    D --> F[The operator sees
a healthy picture]
    E --> F
For the user this means one simple rule: the fact that a device exists in the list does not automatically mean it can be trusted right now. Live state matters more than stored existence.
Line, device, and value freshness
| What you see | What it means | Operator action |
|---|---|---|
| The device is in the list | It is saved in the selected line configuration. | Check connected/online state and latest values. |
| The line is paused or polling is disabled | Background polling is stopped, so fresh values will not arrive. | Resume polling only when it is safe for work on that line. |
| Values are stale/offline | The device is saved, but current data should not be trusted. | Move to Scanner/Inspector or check physical communication. |
Realtime chart on Control
Control refreshes detailed data for the selected device, while the device list stays lightweight. The realtime chart uses only the selected channels of the selected device, and that selection is persisted with the device description. If a channel is not selected, it is not a communication error: it simply is not included in the chart.
Configured and runtime
Settings and the top status row may show both saved configuration and actual runtime state. For example, configuration may say that gateway is off while runtime reports that the service is currently running after a previous start. When they disagree, operator judgment should use runtime state, logs, and observed behavior rather than the saved field alone.
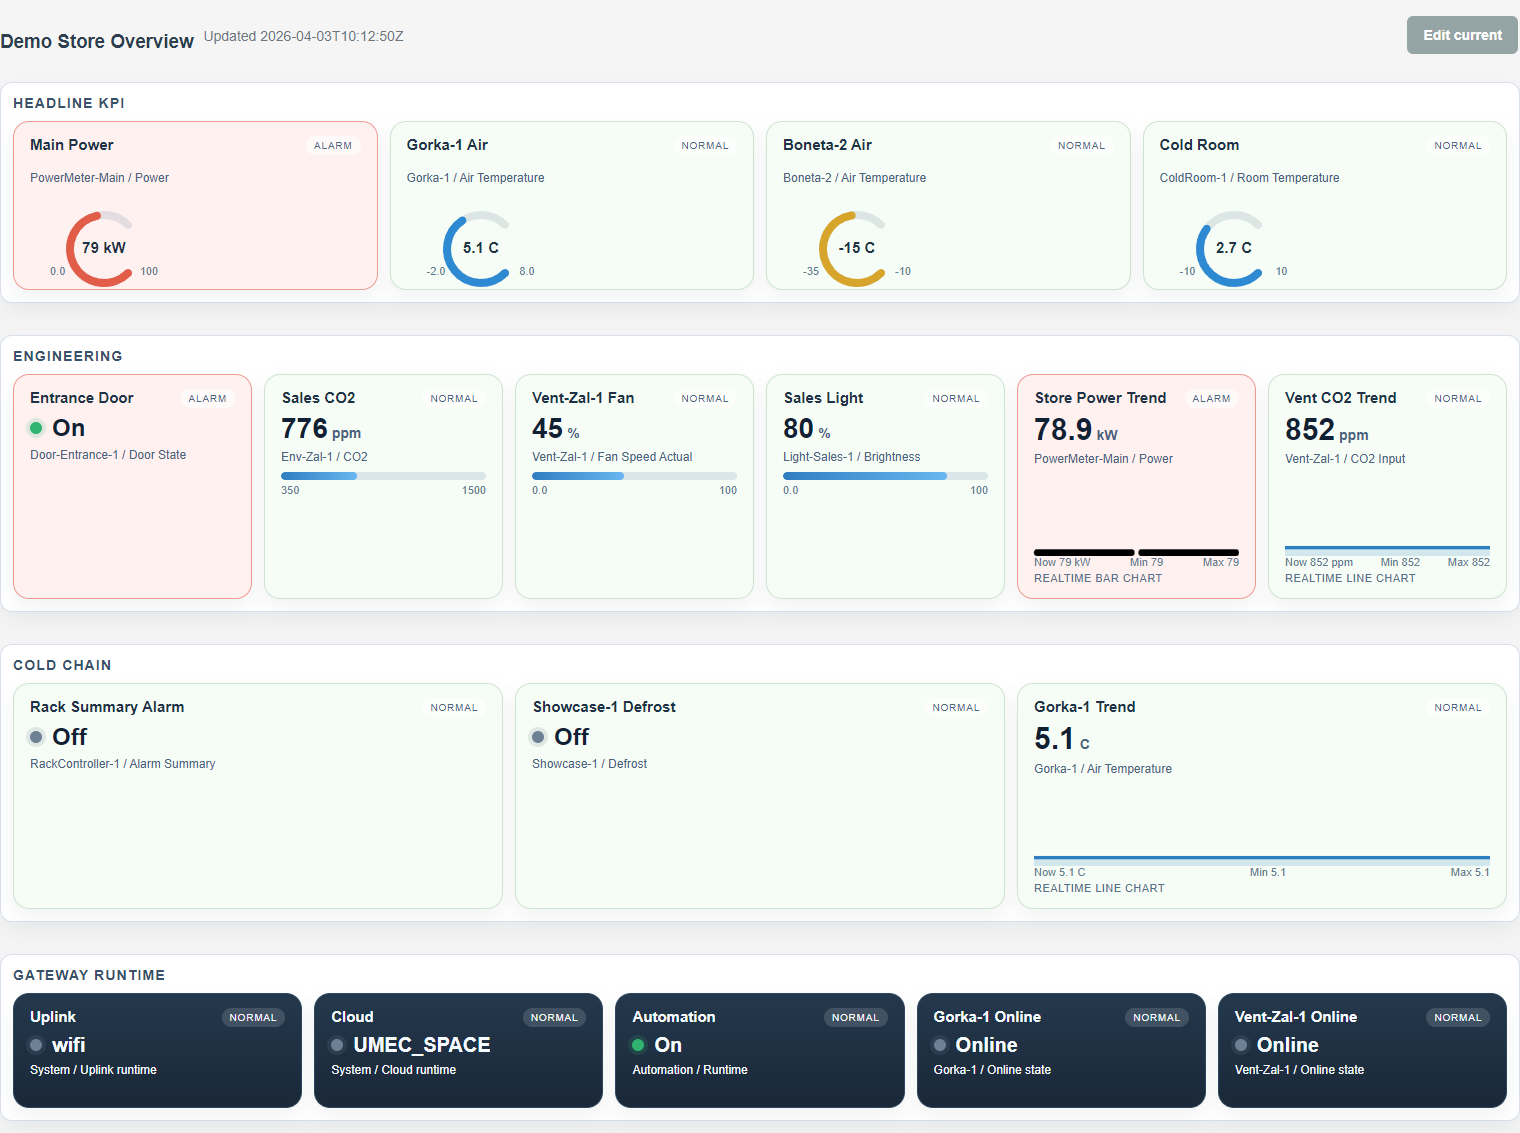
Why dashboards are useful
A dashboard is useful when the operator needs a picture of a whole area, cabinet, room, or system rather than one device. It is not an engineering setup page. It is a working overview.
A good dashboard should answer the question "what is happening on this site right now?" within a few seconds. If that requires opening ten separate device pages, the overview is not doing its job.
When a dashboard helps
When the user needs key temperatures, states, alarms, and trends from several devices at once.
When Control is enough
When the user is working with one specific device and needs detailed values or command actions.
The real goal
Not to show everything, but to show the most important current picture clearly.
What local scenarios are for
Local automation scenarios allow the gateway to react to conditions without waiting for an external platform. For example, when a condition becomes true, the gateway can send a command to the required device.
This is especially useful where quick local reaction matters and where outside connectivity should not be a dependency.
flowchart LR
    A[The gateway receives
current values] --> B[It checks the
scenario conditions]
    B --> C{Is the condition true?}
    C -- No --> D[No action is sent]
    C -- Yes --> E[A command is sent
to the required device]
    E --> F[A record is written
to the scenario log]
Why Scenario Log matters
Scenario Log exists to keep automation understandable. Without it, automation becomes a black box: something happened somewhere, but nobody knows why.
The log helps answer practical questions: did the scenario run, why did it run, why did it not run, and what action was actually sent.
What healthy daily operation looks like
- the operator sees meaningful device names rather than anonymous addresses;
- values can be trusted without constant doubt about freshness;
- commands behave predictably;
- if there is a problem, it is visible and explainable.
When it is time to open diagnostics
If values stop updating, a device disappears, a command does not work, or a scenario behaves in an unclear way, that is the moment to move from normal operation into diagnostics instead of guessing.
Screen examples
These examples show how normal operation differs from loss of communication and how dashboards complement per-device work.
Figure set: healthy Control page
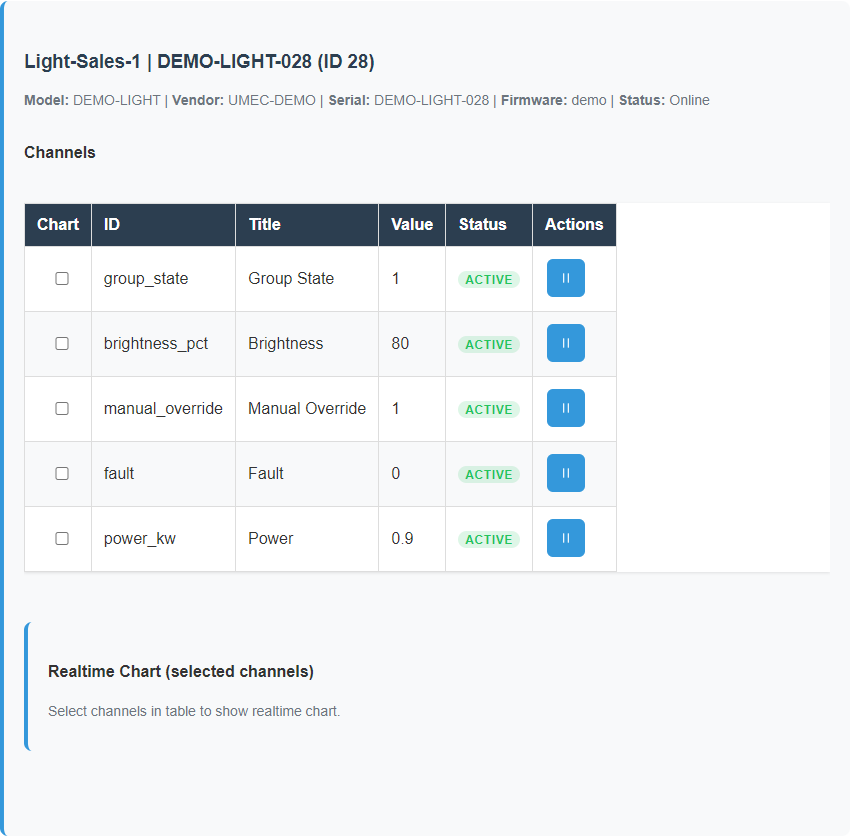
Figure set: stale or offline state
Dashboard overview
Related reference pages
- UI Reference for screen-level meaning and state interpretation.
- Template Formats for payload structure and operator-editable entities.
- Maintenance for service actions and safe recovery steps.