How to use this section
Workflow chapters focus on procedures. This reference focuses on what the operator sees on screen: pages, panels, buttons, selectors, warnings, and changing runtime states.
Screen Naming Rule
The documentation uses the same menu labels that the embedded web interface shows. If a route or source file uses another technical name, the menu label still comes first.
| Embedded menu label | Technical route | Note |
|---|---|---|
| Setup | /setup |
Lines, devices, channels, and commands. |
| Scanner / Inspector | /scanner, /inspector |
Setup submenu tools for line and register diagnostics. |
| ModBus | /control |
Live values and operator commands. Source files may call this screen Control. |
| Automation / Automation Log | /scenarios, /scenario_log |
Rules and their runtime evidence. |
| ModBus Log | /modbus_log |
Line communication history. |
| Storage / Settings / Help | /storage, /setting, /help |
Files, system configuration, and embedded reference. |
What every screen description covers
- Purpose Why the page exists and when to open it.
- Main regions Which parts of the layout carry the most meaning.
- Key controls Which buttons, selectors, and actions are important.
- State changes What changes between normal, warning, and degraded cases.
- Dependencies What changes because of selected line, device, or operating mode.
Screen family map
| Screen | When to open it | Do not confuse |
|---|---|---|
| Login | First access, language selection, credential check. | Solve login problems before Modbus, MQTT, or scenarios. |
| Setup | Define lines, devices, channels, and commands. | A saved device does not mean the device is responding. |
| Scanner | Find responding addresses and test line parameters. | Scanning is diagnostic work and can temporarily take line ownership. |
| Inspector | Manually test registers and targeted Modbus requests. | One successful register read does not replace full device configuration. |
| ModBus | Live values for the selected device, line pause/resume, commands, and realtime chart. | Device presence, connected state, and value freshness are different signals. |
| Dashboards | Area, room, or system overview through widgets. | A dashboard is not for editing Modbus profiles. |
| Scenarios | Create, enable, and disable local automation rules. | Enabled does not mean actions executed successfully; check runtime and logs. |
| Scenario Log | Understand why a scenario triggered or failed to send an action. | Dispatch/action errors matter more than the trigger event alone. |
| Modbus Log | Line communication evidence, log files, export, and filters. | The log is evidence, but it does not replace current runtime on ModBus. |
| Storage | SPIFFS/SD files, configuration, logs, and service exports. | Do not hand-edit JSON when a Setup/Settings form exists. |
| Settings | Mode, Device, Credentials, Network, Time, Uplink, Modbus Lines, Modbus TCP, Integration, Recovery, MQTT, Wi-Fi, Firmware, Maintenance. | Configured and runtime can differ; troubleshooting should use runtime. |
| Help | Built-in reference and format hints. | Help does not replace checking the actual site state. |
Quick overview
Login
First access to the system and the start of every operator session.
Setup
Communication lines, devices, channels, and commands.
ModBus
Live values, device state, and command execution.
Diagnostics
History, evidence, and system support surfaces.
Examples and what to notice
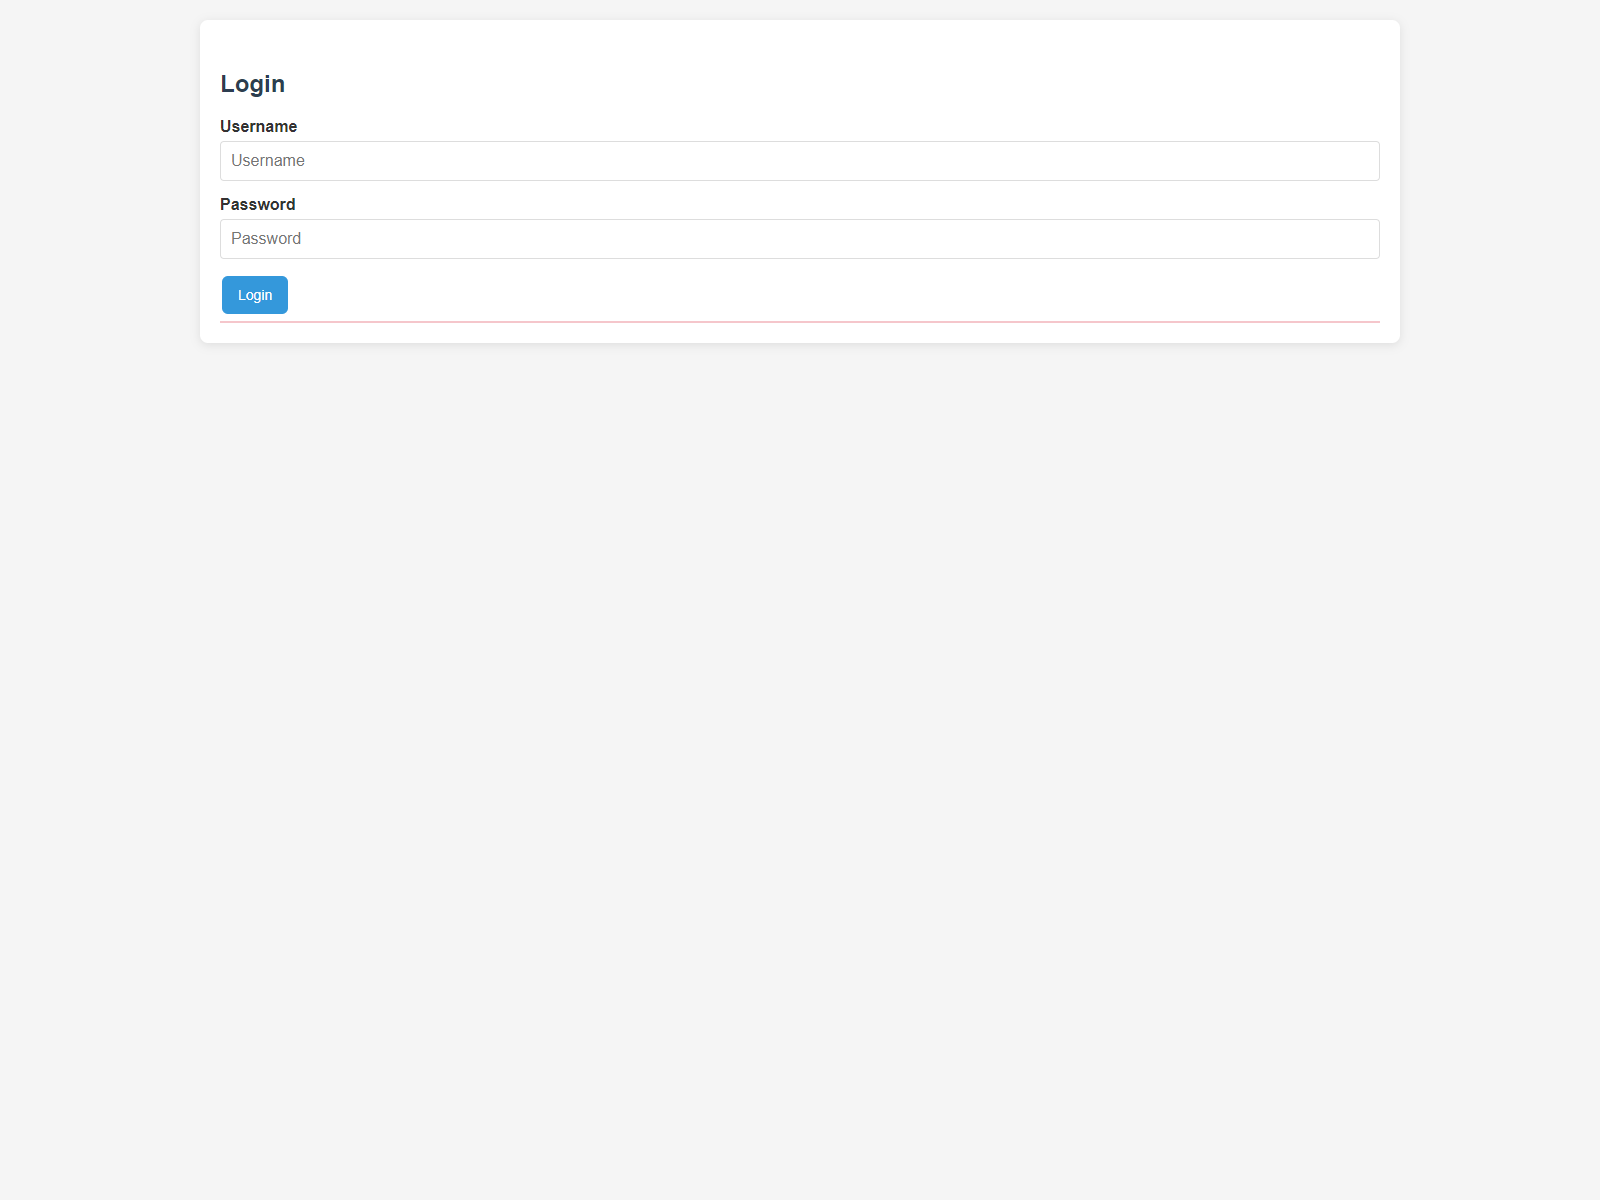
Login
- Purpose: authenticate the operator and enter the web interface.
- Key regions: username, password, submit action, and visible page language.
- What to notice: the page stays minimal and immediately understandable.
Login page
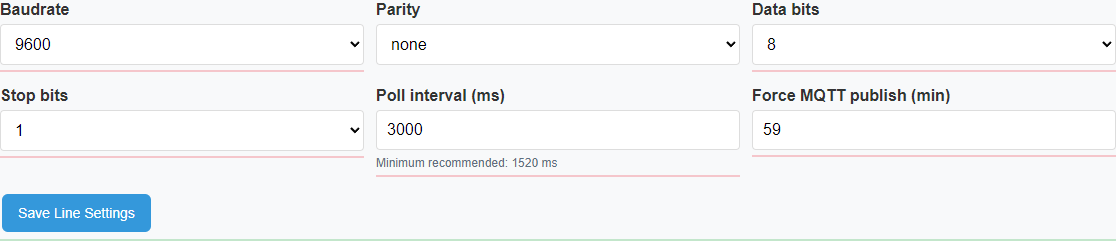
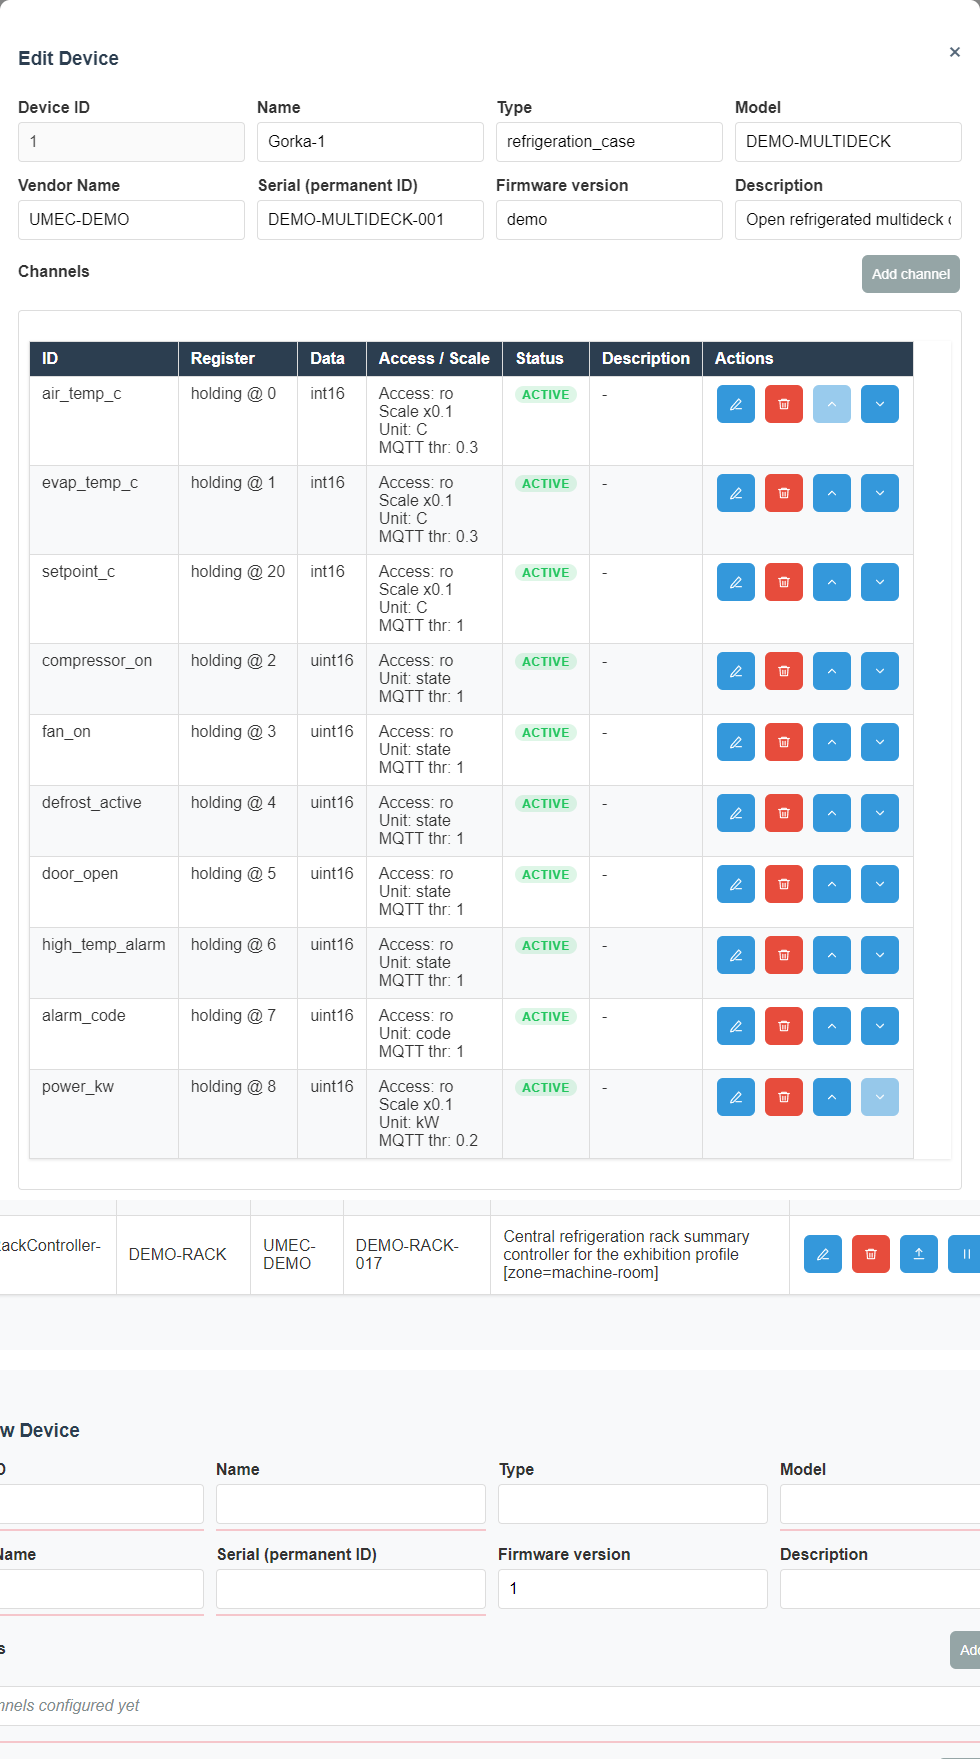
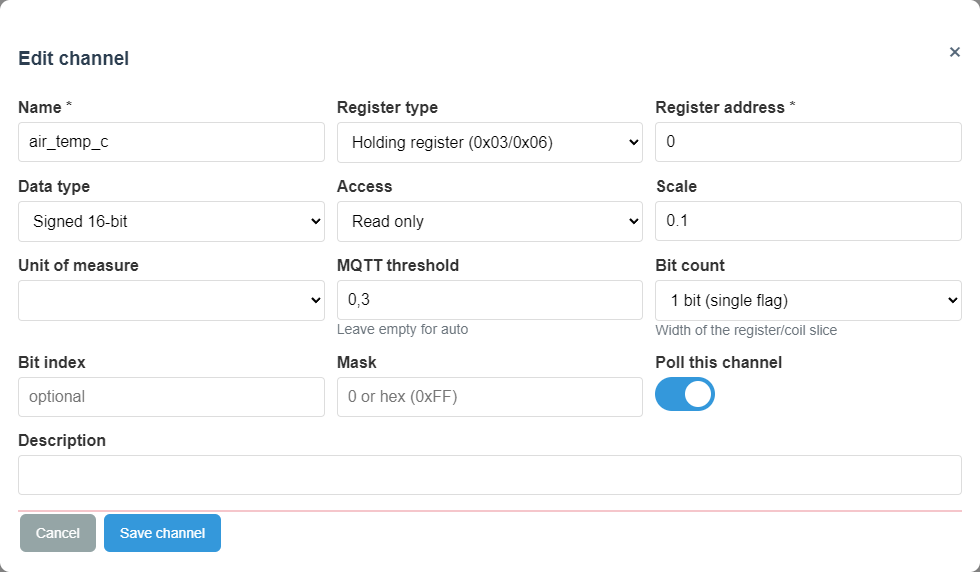
Setup
- Purpose: describe the real system model used later by ModBus, dashboards, automation, and logs.
- Key regions: line settings, device list, device editor, channel editor, and command editor.
- What to notice: each saved field affects runtime behavior later.
Line editor
Device editor
Channel editor
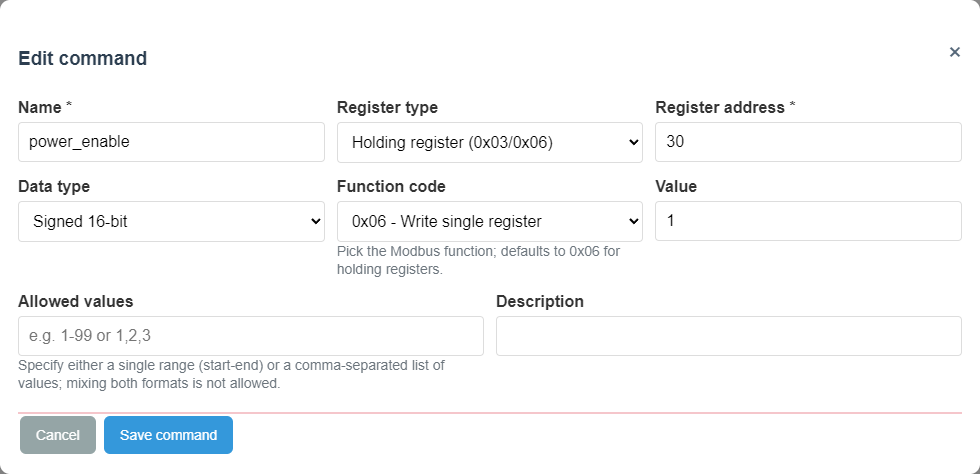
Command editor
Scanner and Inspector
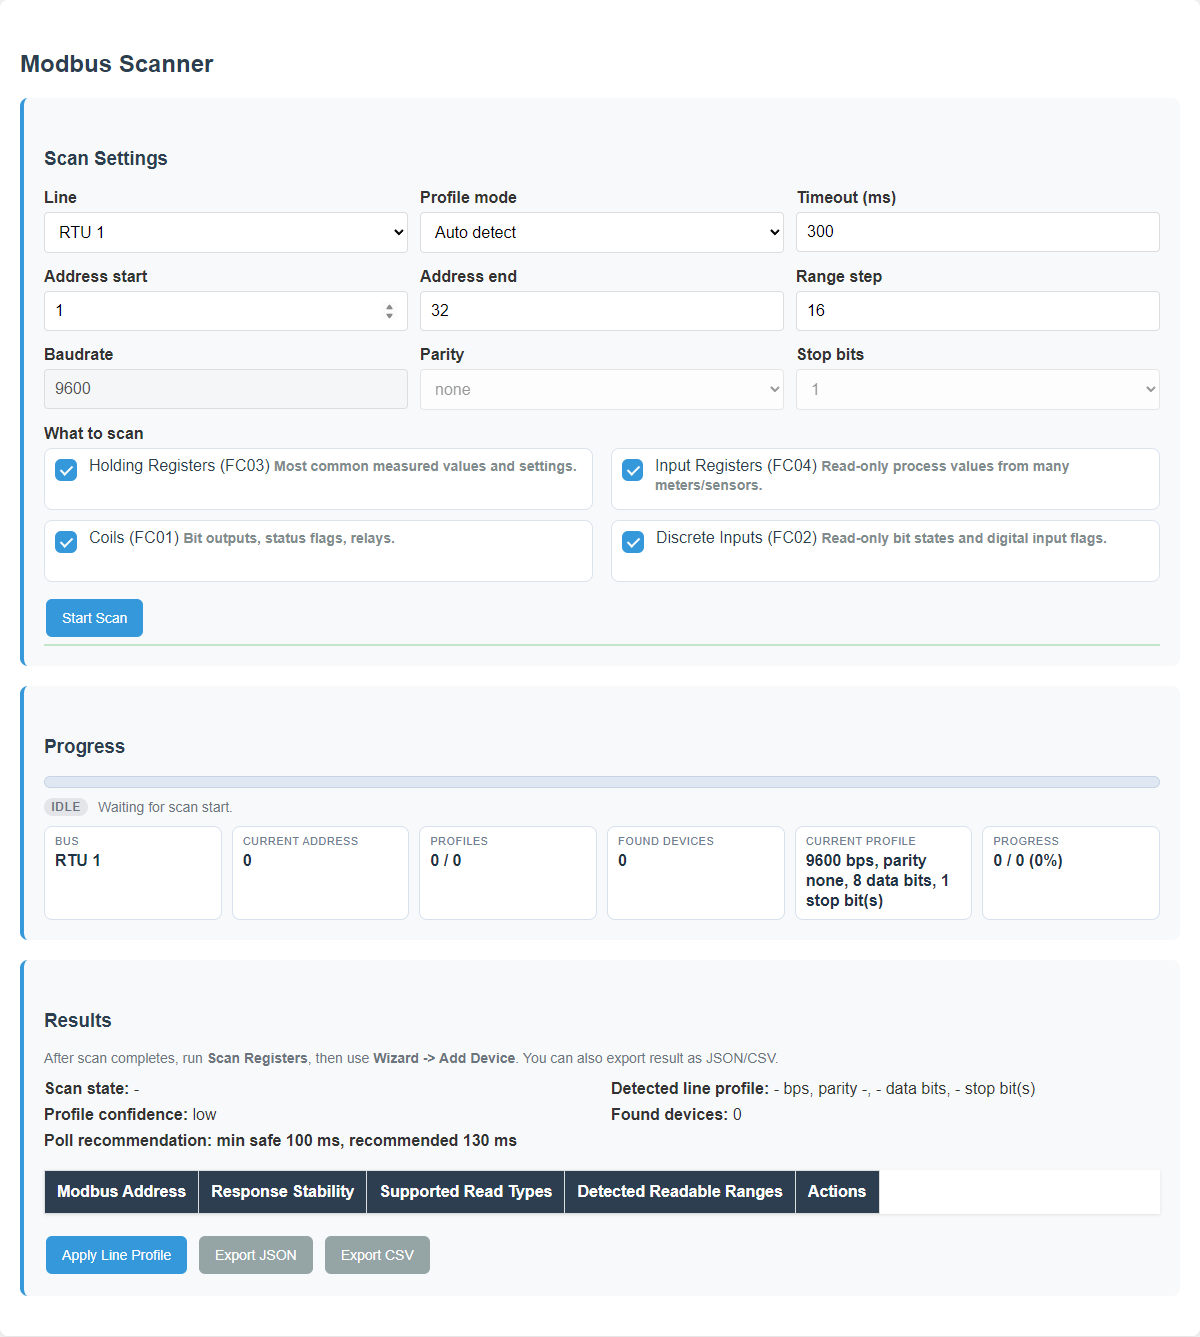
- Scanner purpose: quickly learn which addresses respond and whether line configuration looks plausible.
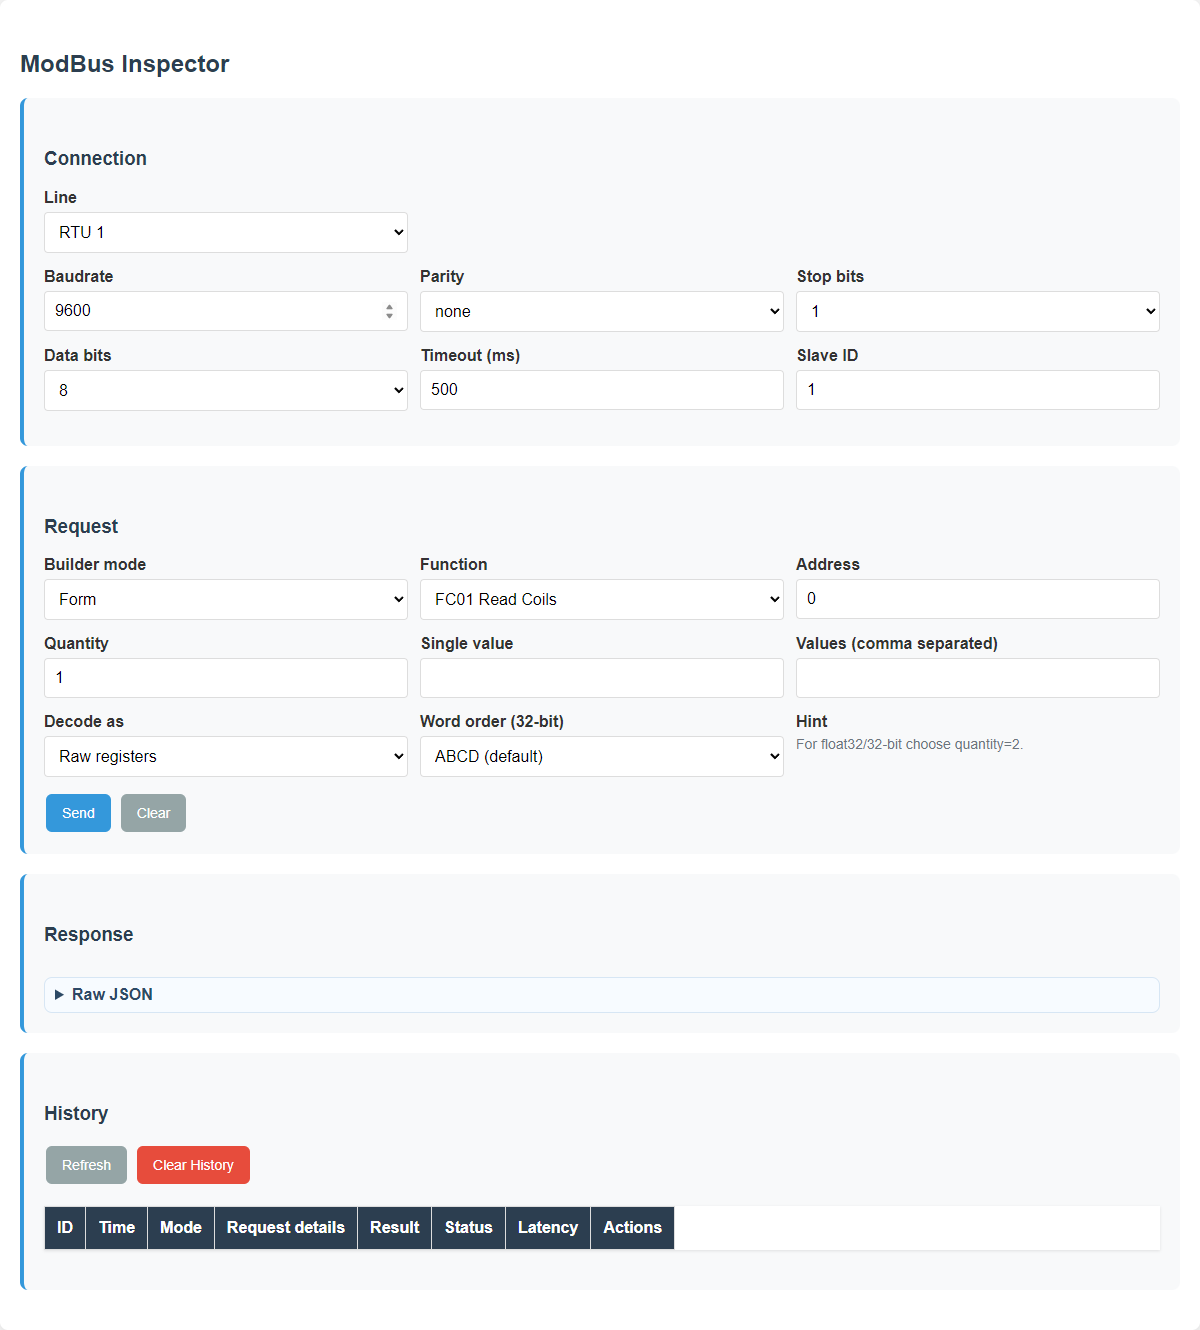
- Inspector purpose: manually test a function code, register address, datatype, or command write.
- What to notice: diagnostic mode should produce a clear result and must not hide line-owner conflicts.
Scanner
Inspector
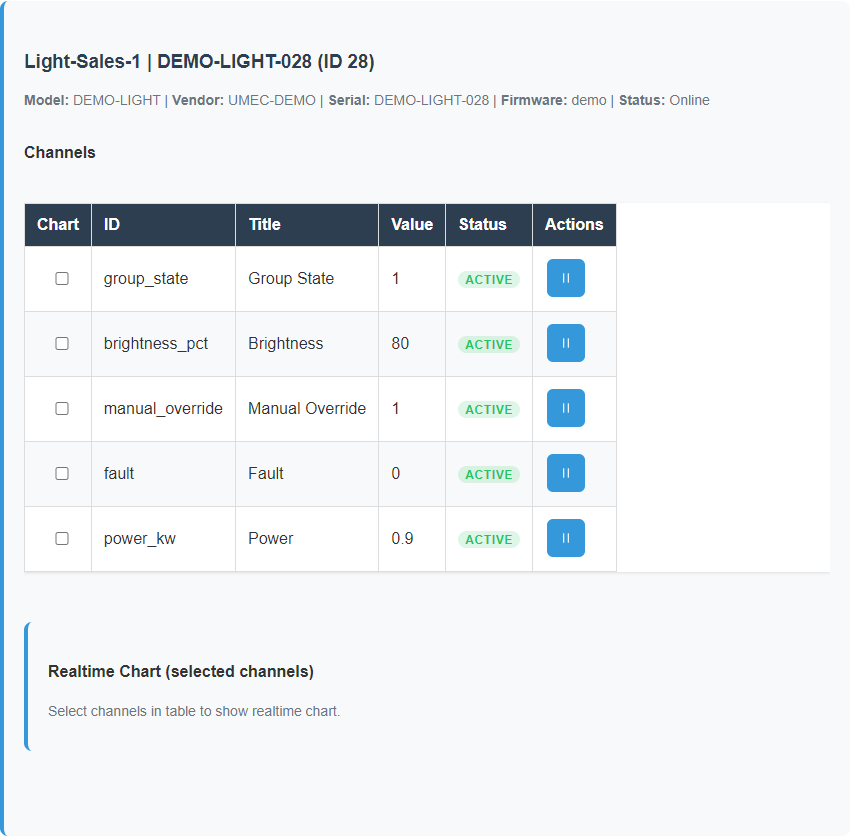
ModBus
- Purpose: inspect live state and send commands to the selected device.
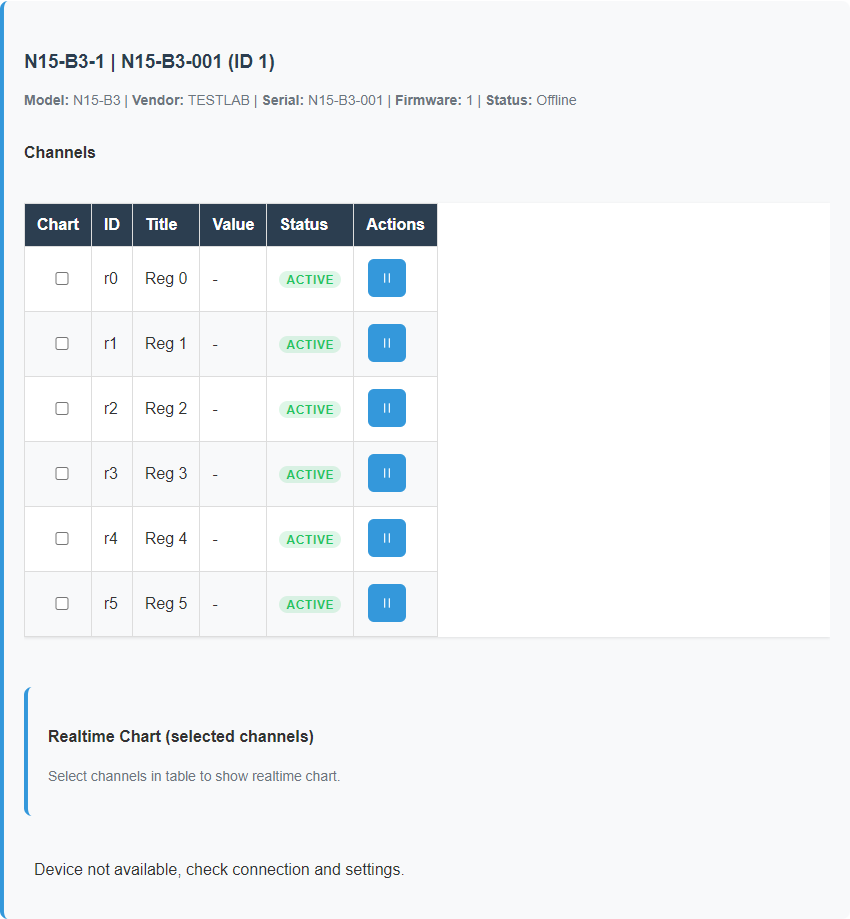
- Key regions: device selector, value area, online or offline status, and command area.
- What to notice: healthy values, degraded trust, and visible result after a command.
Healthy live state

Stale or offline state
Command result
Dashboards
- Purpose: show the state of a zone, room, or system at a glance.
- Key regions: widgets, alarm emphasis, summaries, and navigation between views.
- What to notice: the difference between normal overview and warning state.
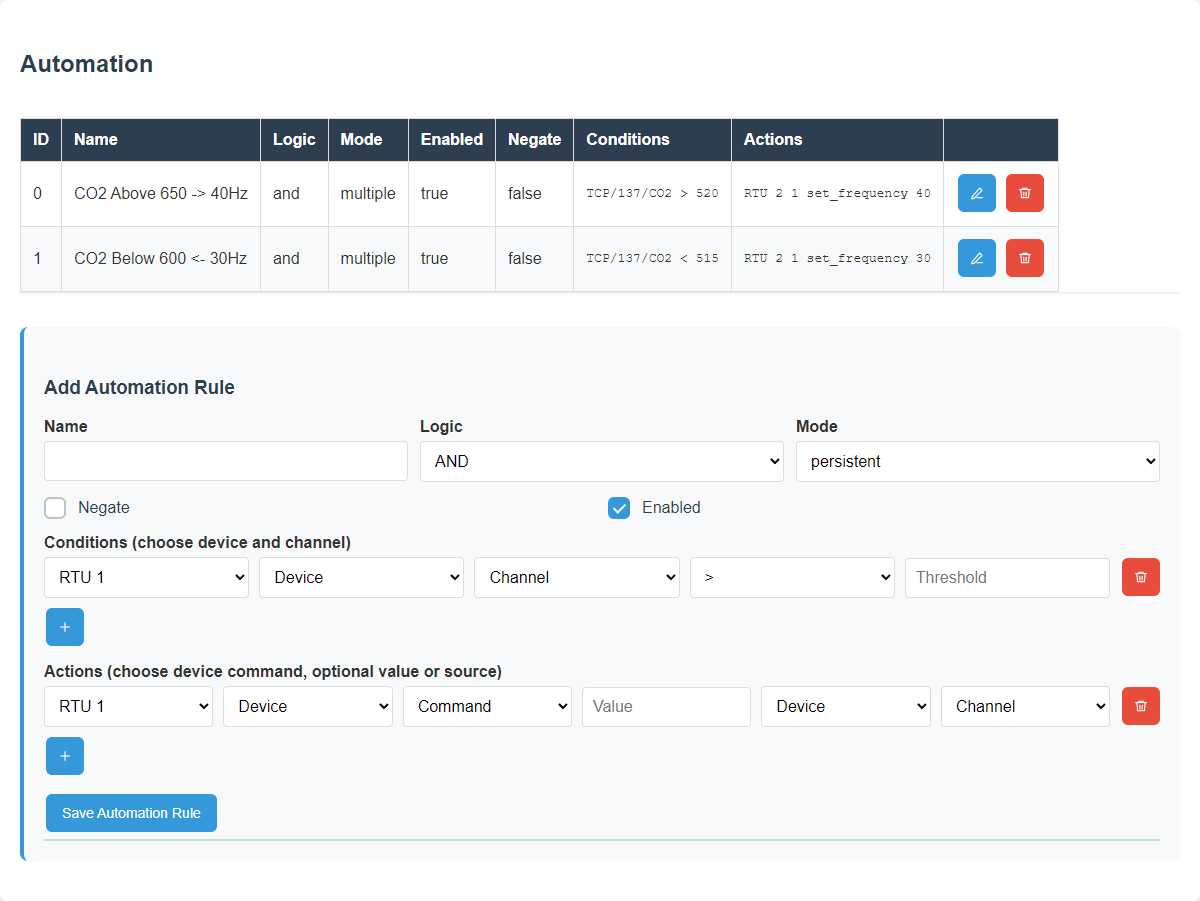
Scenarios and Scenario Log
- Purpose: configure rules and verify later how they executed.
- Key regions: scenario list, editor blocks, enable state, and execution entries.
- What to notice: how rule logic becomes evidence in the log.
Automation
Automation Log

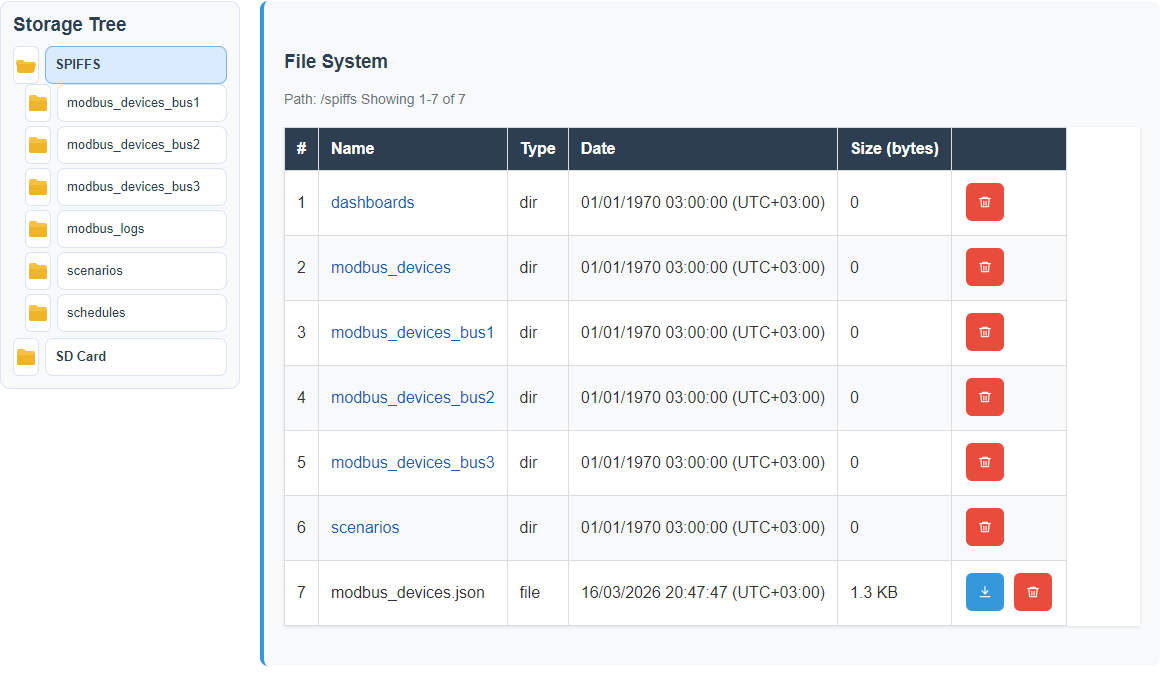
Storage and Modbus Log
- Purpose: inspect files, exported data, and communication history.
- Key regions: tree navigation, file list, selected-file actions, and line-specific history.
- What to notice: where stored evidence differs from live runtime data.
Storage
ModBus Log

Settings and Help
- Purpose: understand system-wide options and built-in product guidance.
- Key regions: operating mode, Device, network, uplink, runtime state, service actions, and Help navigation.
- What to notice: which settings change system behavior, where runtime differs from configured, and which blocks are service-only.
How to read the examples
- Start with the purpose of the page, then inspect the main regions.
- Compare normal and degraded states to see what changes first during a problem.
- Use command examples to verify what successful control looks like in practice.
- Remember that selected line, selected device, and operating mode can change the page content.